Posts

Showing posts with the label Matplotlib

Markov chain Monte Carlo with PyMC

Image
Markov Chain Monte Carlo (MCMC) is a technique for generating a sample from a distribution, and it works even if all you have is a non-normalized representation of the distribution. Why does a data scientist care about this? Well, in a Bayesian analysis a non-normalized form of the posterior distribution is super easy to come by, being just the product of likelihood and prior - so MCMC can be used to sample from (essentially simulate) a Bayesian posterior. In python one of the most widely used packages for doing exactly this is called PyMC . What is Markov chain Monte Carlo A Markov Chain is a sequence of RVs {X} each of which will have an observed value from the state space of possible values, {x}. A Markov Process is a sequence of such RVs where the distribution of the initial RV's value is specified (Π0) as well as a Transition Rule (P) which gives the probability to transition from one state to another, P(i,j)=P(Xn+1=xj|Xn=xi), for all pairs of states. Notice P doe...

Natural Language Processing with Python

Image
Introduction Natural language processing, or NLP, is a process of analyzing the text and extracting insights from it. It is used everywhere, from search engines such as Google or Bing , to voice interfaces such as Siri or Cortana . The pipeline usually involves tokenization , replacing and correcting words, part-of-speech tagging , named-entity recognition and classification. In this article we'll be describing tokenization, by using a full example from Kaggle notebook . The full code can be found on GitHub repository . Installation For the purposes of NLP, we'll be using NLTK Python library, a leading platform to work with human language data. It provides easy-to-use interfaces to over 50 corpora and lexical resources such as WordNet, along with a suite of text processing libraries for classification, tokenization, stemming, tagging, parsing, and semantic reasoning, wrappers for industrial-strength NLP libraries. Installing the package is easy using the Python p...

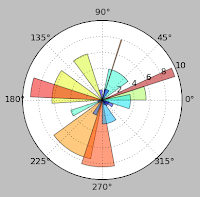
Python for Data Scientists - Matplotlib

Image
Introduction Sure, with both pandas and SciPy you can perform some superb data analysis. And with the IPython , working sure became much easier. But how about presenting your results? Today we'll talk about Matplotlib - our presentation package. Making plots and static or interactive visualizations is one of the most important tasks in data analysis. It may be a part of the exploratory process; for example, helping identify outliers, needed data transformations, or coming up with ideas for models. Installation Installation of matplotlib is easy. If don't have it preinstalled as part of your Python distribution, just do it manually using python package manager pip install matplotlib Usage Since we're already familiar with IPython, I'll be only covering it's usage as this is a preferable way of writing data analysis procedures. In console mode graphs are plotted in a separate newly created window, each time you render a plot. In web mode, it's b...